Dive Deep into Regression Analysis: A Comprehensive Guide
Welcome to my comprehensive guide on regression analysis. It’s a key technique in statistical analysis and data science. We’ll explore the world of regression, from its history to its use in various fields. This guide is perfect for both newbies and seasoned data analysts. It aims to give valuable insights into regression analysis for making smart decisions with data.

Key Takeaways:
- Regression analysis is a fundamental technique in statistical analysis and data science.
- It has a rich historical context dating back to Francis Galton’s work on correlation and regression in genetics.
- Regression analysis is used in various fields, including economics, biology, machine learning, and artificial intelligence.
- Understanding the fundamentals of regression, such as the different types and their mathematical formulations, is essential.
- Regression analysis allows us to model and predict the relationship between variables. This helps us make accurate predictions and get valuable insights from data.
Fundamentals of Regression
In regression analysis, understanding the basics is key. These basics help predict and study how variables relate in models. The dependent variable and independent variables stand at the heart of this.
The dependent variable is the outcome we want to predict. For instance, in a study on study hours and exam scores, the exam scores are the dependent variable.
Meanwhile, independent variables are what we think affect the dependent variable. In the study hours and exam scores example, study hours would be the independent variable.
There are different types of regression models, each with its use. Some include:
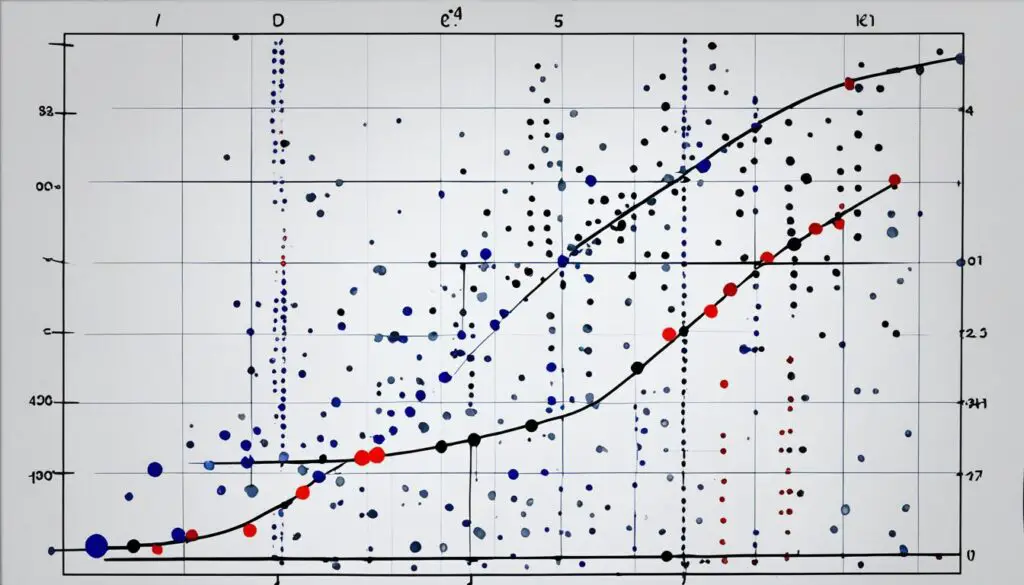
- Linear Regression: It’s basic and predicts numerical values. It fits a straight line to the data.
- Multiple Linear Regression: It uses several independent variables to predict the dependent variable.
- Logistic Regression: It’s for predicting binary or categorical outcomes, like true or false. It deals with probabilities.
Learning these models and basics prepares you for using regression in real-world fields. Next, we’ll focus on linear regression’s details.

Linear Regression
Linear regression is a fundamental type of regression analysis. It shows the link between a main variable and others using a simple equation. This equation includes numbers for the line’s steepness and where it meets the axis. It assumes the relationships are straight, data points are not related, the errors’ sizes don’t change, and the mistakes follow a normal pattern.
Let’s look at the pieces of linear regression:
- Dependent Variable: The outcome we aim to forecast, often a number, is the dependent variable.
- Independent Variables: These are what we think affect the dependent variable. We can include many in the model.
- Mathematical Formulation: The link between the dependent variable and independents is a linear equation. For example:
y = b0 + b1x1 + b2x2 + … + bnxn
This equation means:
- y is what we are trying to find out
- x1, x2, …, xn are the influences
- The b’s are the line’s shape and starting point
These are the key assumptions of linear regression:
- Linearity: The few effect the dependent variable in straight ways.
- Independence of Observations: One data point doesn’t affect another.
- Constant Variance of Residuals: The error in our model doesn’t change its size based on the data.
- Normal Distribution of Errors: Our model’s mistakes follow the normal curve.
People use linear regression in many areas. It’s crucial in:
“Economics, weather forecasting, and finance, among others. It helps predict a product’s popularity by its cost and other factors. In weather, it forecasts temperatures using humidity and air pressure. This method is key for understanding how variables connect and making predictions based on data.”
Real-World Example:
For finance, imagine forecasting a stock’s price using its sales and ad spending. We look at past data to see the relationship between these factors. Our linear model is:
Stock Price = b0 + b1(Quarterly Revenue) + b2(Advertising Expenses)
We find the coefficients, understand what they mean, and guess the stock’s future price based on these factors.

| Variable | Description |
|---|---|
| Stock Price | The dependent variable – the value we want to predict. |
| Quarterly Revenue | An independent variable representing the company’s revenue in a quarter. |
| Advertising Expenses | An independent variable representing the company’s expenses on advertising in a quarter. |
This table sums up our analysis to predict a stock’s price using sales and ad costs.
Conclusion
Regression analysis is a key part of data analysis and machine learning. It helps us understand and predict how variables are related. This lets us make accurate predictions and find important insights in data.
The future of regression looks bright in our data-focused world. With new tech and methods, we can do more with regression. The use of AI and machine learning will make it even better at predicting and analyzing data.
As more businesses turn to data for answers, knowing regression will be very important. It helps companies run better, decide smarter, and spot useful patterns. Let’s keep learning about regression. It holds a lot of potential for changing the future.
