Welcome to the first section of our comparison studies article. Here, we dive into the methods and approaches for study comparison. This is an essential part of research, helping us understand how different methods measure up. It also lets us find both similarities and differences to draw solid conclusions. Knowing how to compare studies boosts your research skills and contributes to your field’s knowledge.
We will look at how to design method-comparison studies in this section. This includes picking measurement methods, when to measure, how many times to measure, and working with different health conditions. We’ll also cover how to check data visually and use specific statistics for precision and bias. Learning about these will prepare you to analyze method-comparison studies effectively.
No matter if you’re an experienced researcher or new to the field, this section offers important tips and methods. It’s all about improving your research skills. So, let’s explore how to compare studies!

Key Takeaways:
- Comparing studies lets us see how different measurement methods stack up.
- Knowing the right methodology and approaches improves our research abilities.
- When designing method-comparison studies, we must choose measurements wisely and consider many details.
- Checking data visually and using specific statistics are key steps in the analysis of studies.
- Improving how we interpret and apply our research skills helps us get accurate insights from method-comparison studies.
Method Comparison Study Design
When you set up a method comparison study, study design is key. The design choices influence how reliable and valid the study’s results are. We’ll dive into what makes a strong method comparison study design. This includes picking measurement methods, deciding when to measure, and thinking about different body conditions.
Selection of Measurement Methods
The first step is to pick the right measurement methods. These methods need to measure the same thing for a fair comparison. Check that each method’s specs match up to ensure fairness.
For instance, let’s say you’re testing two blood glucose methods. Ensure they both measure blood sugar levels accurately. If one captures all blood glucose and the other just the plasma glucose, they can’t be compared fairly.
Timing of Measurements
When measurements are taken really matters. Try to take measurements at the same time from the same people. This way, you’re comparing results directly.
Taking measurements at the same time means issues like body changes over time won’t skew results. It makes sure any differences found are from how the tests are done, not the changing body conditions.
Consideration of Physiological Conditions
It’s vital to look at a variety of body conditions in your study. Use people of different ages, health conditions, and those on various medications. This helps check if methods work well in different situations.
For instance, when looking at lung function tests, use a mix of people. Include healthy ones and those with lung problems. This mix helps understand if the methods perform the same across all lung abilities.
Statistical Tests
Picking the right stats tests is very important. Common tests like t-tests can’t always be used for method comparisons. They might not show the full picture or could be misled by unusual data points.
It’s better to use tests made for method comparison. Examples are Bland-Altman, Deming regression, or specific models. These are better suited for the job. They account for test result variability and show a clearer picture of how methods compare.
“Choosing the right statistical tests is crucial in method comparison studies. Using inappropriate tests can lead to erroneous conclusions and hinder scientific progress, so it’s important to select tests specifically designed for this type of analysis.”

A great study design looks at many things: how you measure, when you measure, who you include, and the stats tests you pick. Proper planning and execution ensure your study gives valid and clear method comparisons.
Scatter Plots and Difference Plots for Method Comparison
Studying methods with scatter plots and difference plots helps highlight how well they agree. They show the variability and agreement of matched measurements effectively. This allows for a deeper understanding of the data.
Scatter Plots: Visualizing Variability
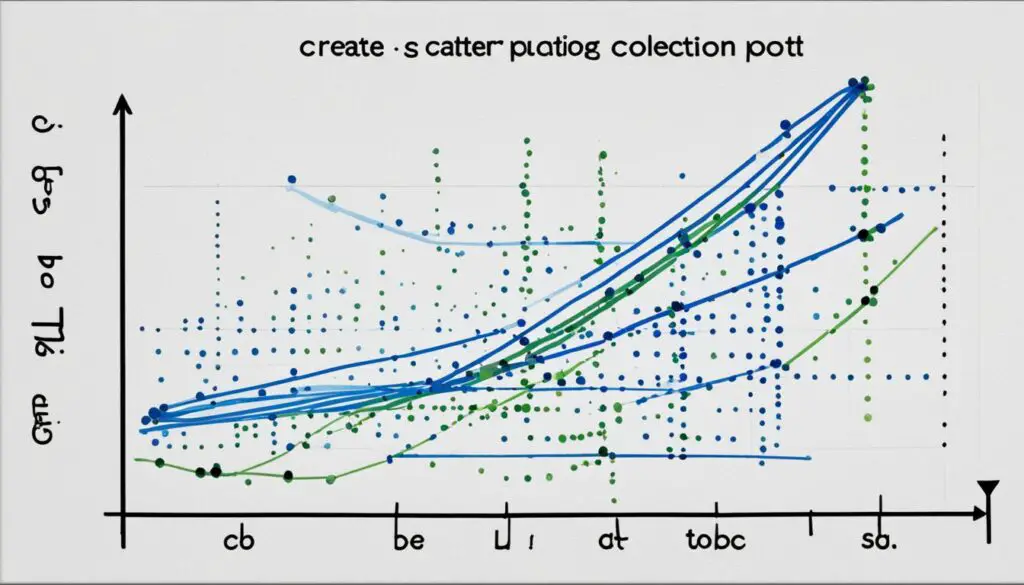
A scatter plot shows the link and differences between matched measurements well. When used in comparison studies, they illustrate where methods agree or differ as values change.
In these plots, data points are placed to see how they spread from a line of equal measures. A tight cluster shows better agreement. A wider spread could mean there are differences to note. This allows for easy spotting of biases or trends and for checking overall agreement.
Adding more details, like lines and intervals, helps in understanding the data more deeply. These details make the data easier to interpret. They guide researchers to more solid conclusions about method comparability.
Difference Plots: Describing Agreement
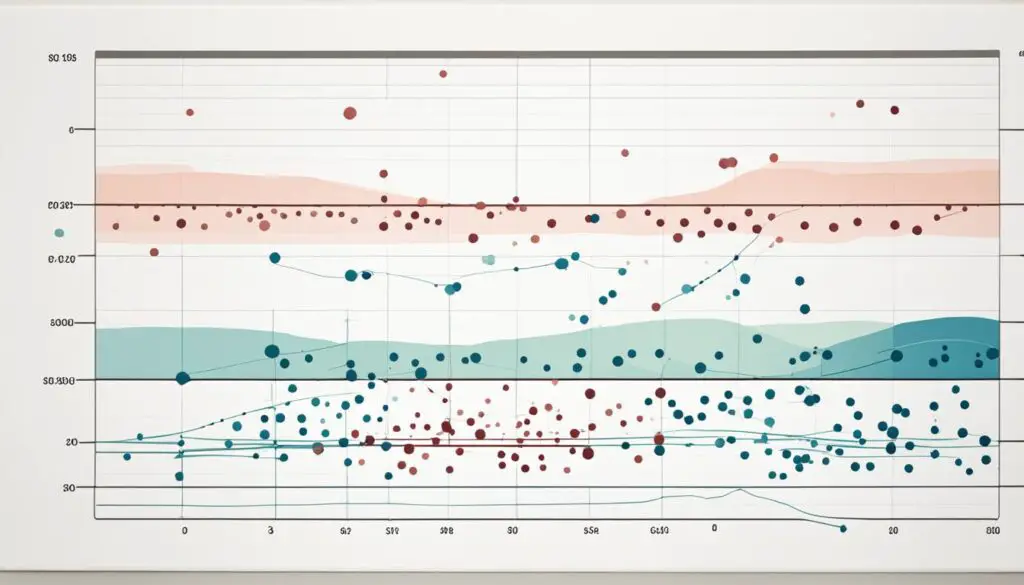
Difference plots, like Bland-Altman and Krouwer plots, show how well methods match up. They reveal the size and direction of differences between measurements. This gives a clearer look at their agreement.
The Bland-Altman plot shows difference against average on the axes. It helps see the agreement by examining each data point around the zero line. It also points out any patterns or outliers that could affect the comparison.
The Krouwer plot offers another way to look at agreement. It focuses on how measurement ratios vary, highlighting if this is consistent. It’s useful for detecting possible proportional bias or non-constant variability.
Addressing any issues found in these plots is critical before more analysis. It’s key to ensuring the study’s accuracy and reliability in drawing conclusions from the gathered data.
Scatter and difference plots are essential for method comparison studies. They offer visual means to understand the variability and agreement in measurements. Their use helps researchers analyze their studies more effectively and make trustworthy conclusions.

Conclusion
This article has shown why method-comparison studies are key in science. They help check if different ways of measuring are similar. Using the right study design and statistical methods can give reliable results.
We’ve talked about how to make sense of study results and improve research skills. Methods like scatter plots and difference plots are important. They help us see how well measurement ways agree.
It’s crucial for scientists to know the details of method-comparison studies. Following the advice shared here can boost their skills. This work aims to make science better, improving our knowledge across many areas.
FAQ
What are method-comparison studies?
These studies compare various ways of measuring the same thing. They check how well these methods agree and perform.
Why are method-comparison studies important?
They are key to figuring out which measurement methods are trustworthy. They analyze the precision and accuracy, leading to the selection of the best method.
What are some factors to consider when designing a method comparison study?
Key factors include picking methods that assess the same thing. Timing measurements to match, deciding how many measurements are enough, and considering different body states, like health conditions, are crucial.
What statistical tests should not be used in method comparison studies?
Avoid using correlation analysis and t-tests here. They don’t assess method differences accurately and could result in false conclusions.
How can scatter plots and difference plots be used in method comparison studies?
Scatter plots show how measurements vary across different values. Difference plots, like Bland-Altman and Krouwer, help analyze method agreement precisely.


