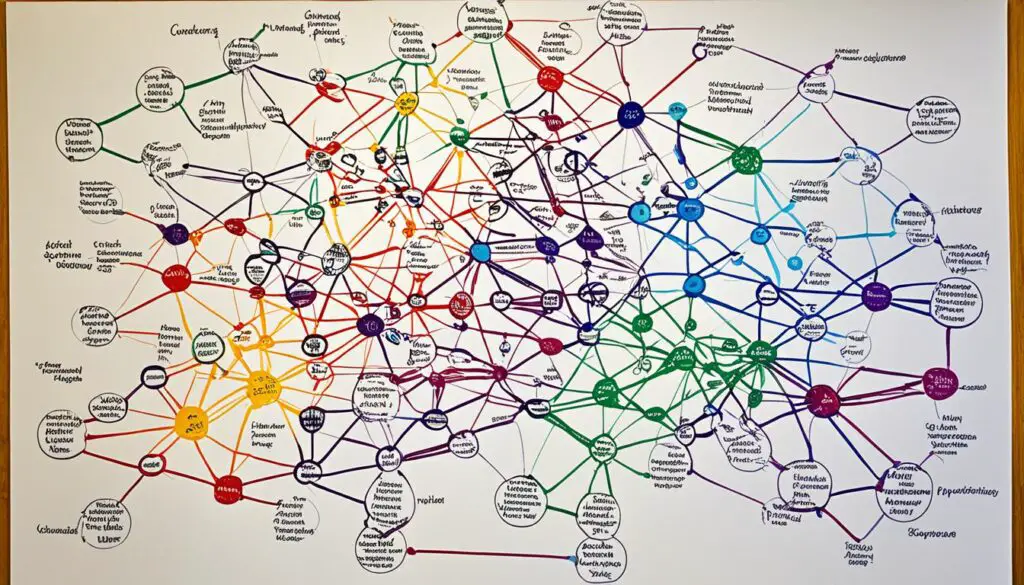
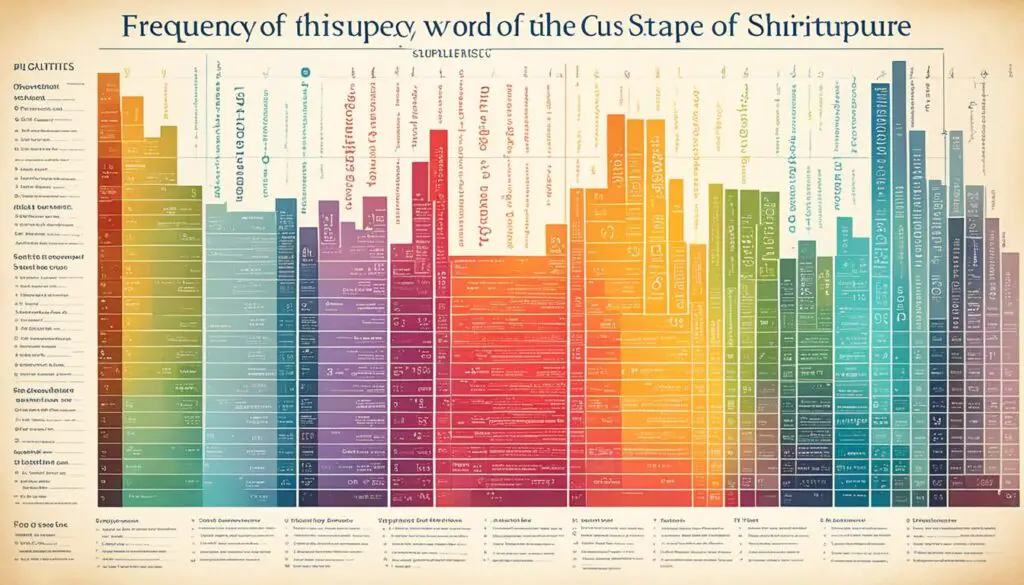
Data visualization helps us understand scripture better. This tool isn’t just for numbers. It’s great for looking at and interpreting biblical writings too. For centuries, Bibles have used pictures like family trees and maps. They make hard parts easier to understand.
Now, we can make these visuals digital. This means we can learn even more about scripture. We can focus on topics that interest us the most. And, we find new meaning in the stories and messages of the Bible.

Key Takeaways
- Data visualization is a powerful tool for understanding scripture.
- Visualizations like genealogical charts and maps can aid comprehension.
- Word frequency analysis and timelines can highlight important themes.
- Interactive digital elements provide a deeper understanding of scripture.
- Data visualization allows students to gain new insights.
The Importance of Data Visualization in Scripture Study.
Data visualization is key in helping us understand scripture better. Studies show our brains do well with visuals. They help us get scripture’s meaning more quickly.
Images have been used to help us understand scripture for a long time. Things like family trees and maps in Bibles make it easier to grasp stories. This method makes the Bible’s complex parts easier for everyone to get.
“The power of visual representation in scripture study is immense. It enables readers to see connections, identify patterns, and gain a deeper understanding of God’s message.” – Dr. Sarah Thompson, Biblical Studies Professor
Using color to mark important parts of scripture is common. Highlighting key verses in red helps readers focus on the main points. Maps showing where biblical people traveled also make the stories easier to follow.
Images don’t just get our attention; they also touch our hearts. Engaging with Bible stories through art can be powerful. It leads to a deeper understanding and a personal connection with the text.

Data visualization helps us to understand God’s message better. By using images, we engage our brains in a different way. This makes studying the Bible more meaningful and enjoyable.
The Future of Data Visualization in Scripture Study.
The future of data visualization in scripture study is very promising. With advancing technology, we’ll see more engaging visualizations. These visuals will offer valuable context, helping us understand scripture in new ways.
One exciting area is the rise of apps like Viz.Bible. They let users explore the Bible in fresh, interactive ways. By using interesting visuals and easy-to-use interfaces, these apps make studying scripture more personal and engaging.
Another cool project is Theographic. It aims to present Bible knowledge in visually appealing ways. This makes complex ideas easy to understand. By sharing information clearly and interestingly, Theographic sparks interest and aids deeper biblical study.
Data visualization helps make studying scripture easy, fun, and visually rich. It’s changing how we understand and connect with the Bible. This trend promises to bring even more insights and knowledge. It guides us to a closer relationship with the divine word.
FAQ
How can data visualization enhance our understanding of scripture?
Data visualization helps us look at biblical text in new ways. It uses charts, maps, and timelines to show information. This can help people see the big picture and understand key ideas more clearly.
Why is data visualization important in scripture study?
Our minds are great at processing images. Using visual tools helps keep people focused and interested. It also sparks thoughts and questions, making the study more engaging and memorable.
What is the future of data visualization in scripture study?
New technology lets us create insightful and fun ways to explore the Bible. Apps and projects online are making scripture study interactive and engaging. They help us learn more and discover new meanings in the text.


